
At ACE IoT Solutions we work with customers to help them implement low cost, open source solutions to acquire data from diverse equipment and control systems. We take pride in deploying solutions that help make our clients’ data more observable and - as a result - more valuable.
Indeed, our work with a customer rarely culminates with a CSV file. In most cases, our work with clients involves both data acquisition and efforts to ensure our clients have improved visibility into their building and energy data.
What do we mean by Data Observability?
The concept of observability is a hot topic in distributed and cloud-based systems, where hundreds or even thousands of services need to be monitored and orchestrated. Software engineers with an emphasis in Development Operations (DevOps) apply concepts of agile, lean, and continuous integration to identify, assess and predict the behavior of a system. Observability is an attribute of a software system that facilitates efforts to a) ascertain if a system is working as designed and b) identify bugs in a system that is not performing as intended.
Data observability applies concepts of DevOps to the development of high-quality data ecosystems. For more about the theory and principles behind ACE IoT’s approach to delivering observable data pipelines, see a seminal blog from Lenny Liebmann, Contributing Editor at Infoweek Magazine and the DataOps Manifesto.
How do we deliver Data Observability?
In our work at ACE IoT, we use an open source tool for monitoring and dashboarding called Grafana. We employ Grafana to provide clients a data and systems visibility platform. Using a Grafana platform, our clients can explore the data collected by Eclipse VOLTTRON and identify new - perhaps unforeseen - value streams. Using Eclipse VOLTTRON and Granfana in tandem means that our clients are not limited to pre-configured data dashboards or CSV files. Our clients have the flexibility to build the data views they find most helpful for their business use cases.
“Our clients have the flexibility to build the data views they find most helpful for their business’ use cases”
At last year’s GrafanaCon EU, ACE IoT’s own Andrew Rodgers showcased how we use Grafana to deliver unique value to facilities operators working in the built environment.
Illustrations of data views enabled by Eclipse VOLTTRON and Granfana:
Illustration #1 - Visualizing Space Temperature
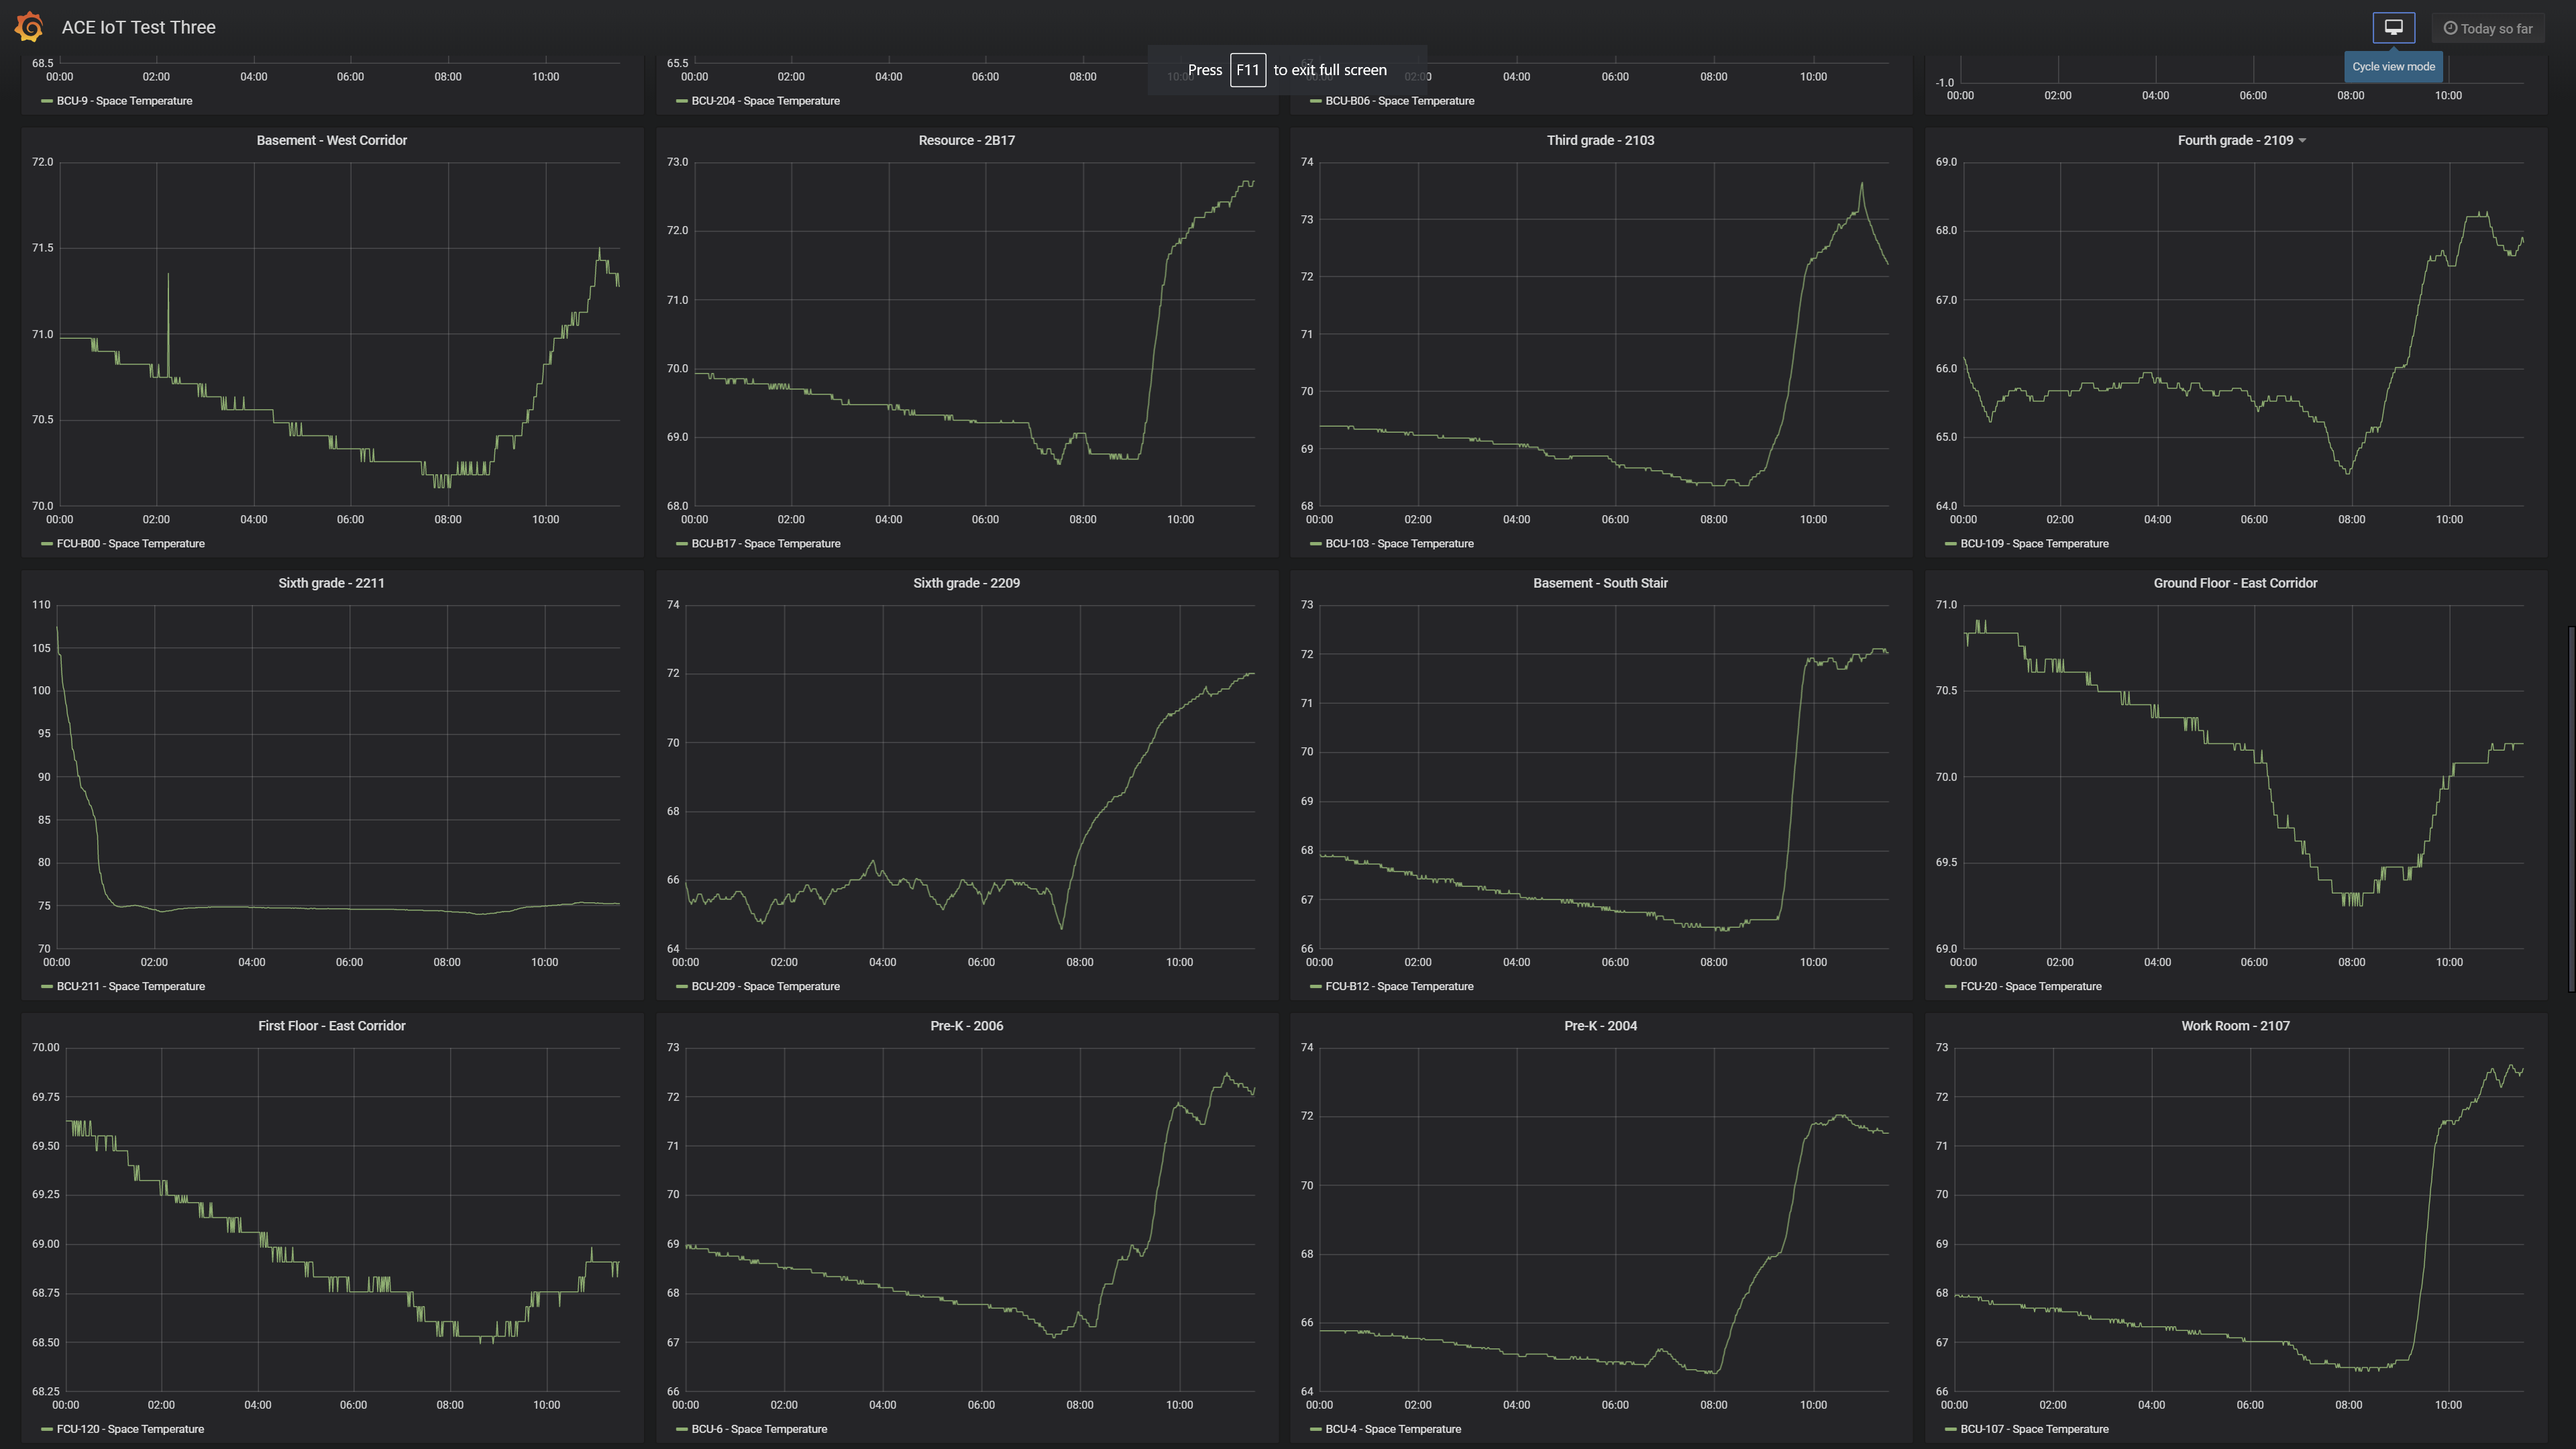
Granfana enables views of data streams from across a facility operator’s portfolio. In the screenshot above, the dashboard collects data from nine rooms that are designated high priority.
Illustration #2 - Systemic View of a Single Room or Single Zone
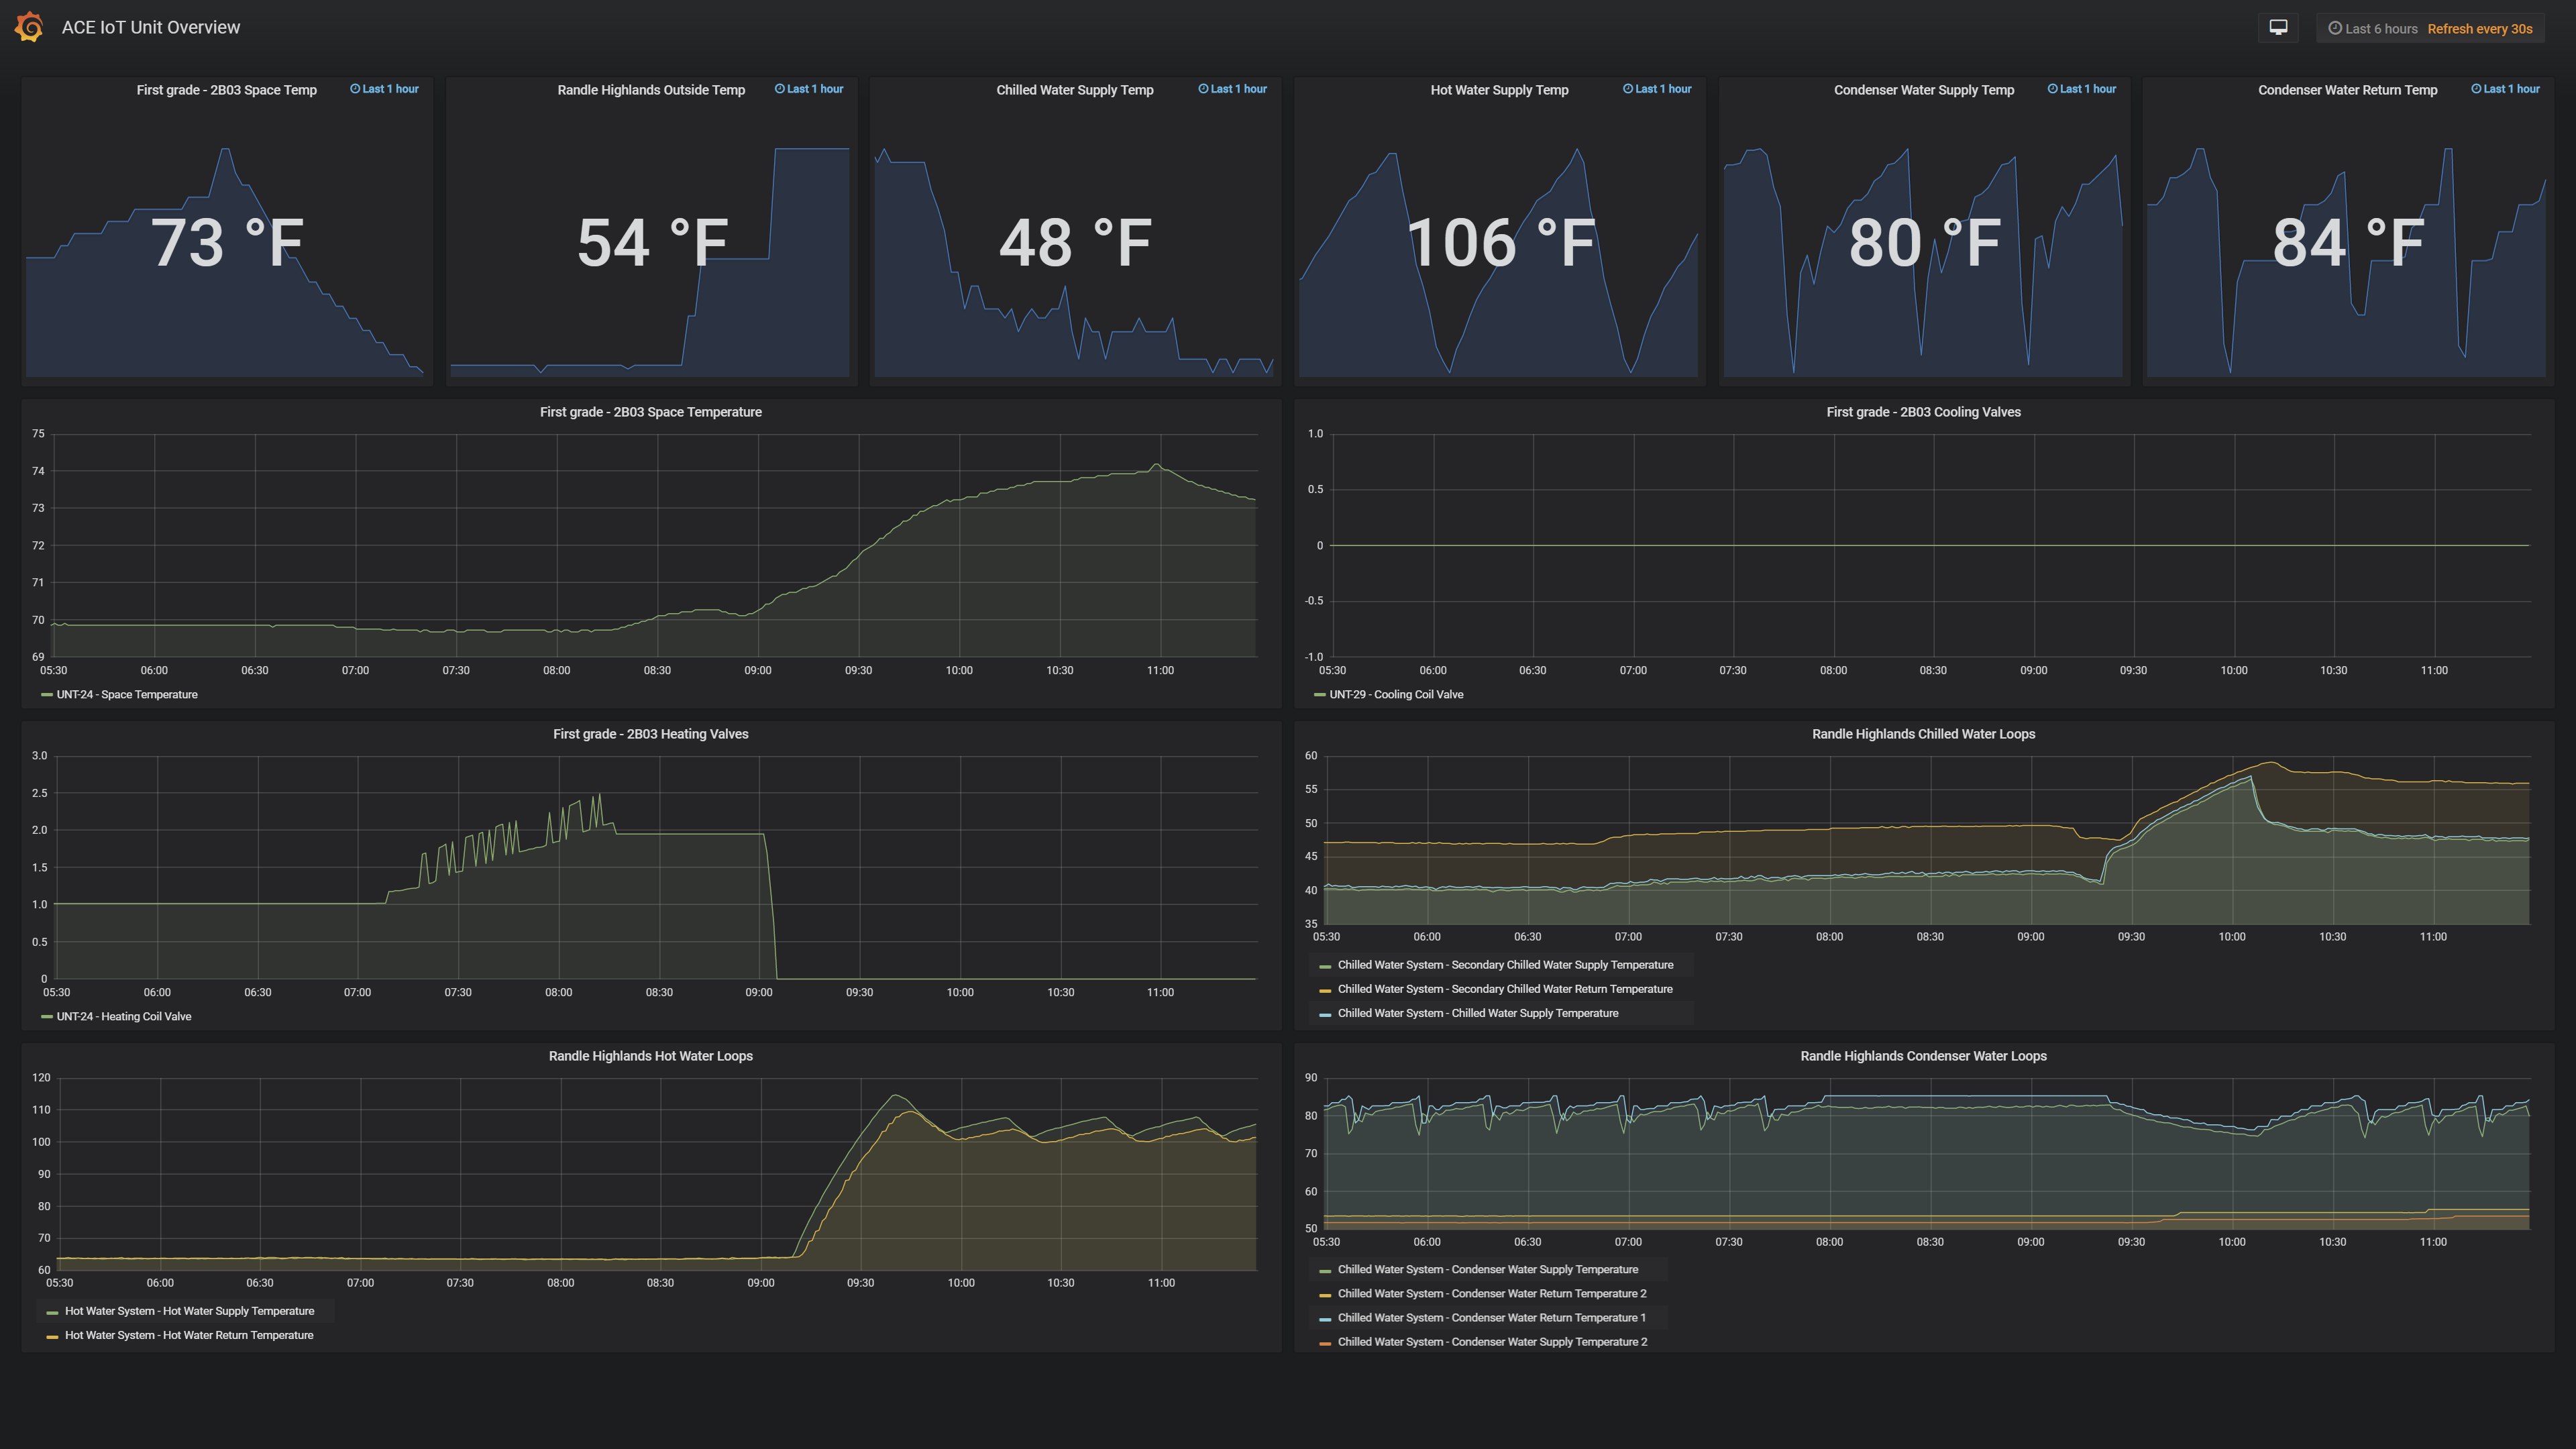
In contrast to billing data made available by utilities, VOLTTRON collects disaggregated data that facilities operators can use to diagnose or predict issues that are impacting a building’s performance. In the illustration above, metrics for a designated room are found on the top of the image and key inputs into the room’s performance (e.g. heating and cooling values, etc) are visible below the metrics.
Contact us to explore what projects we can do together!

