Q: Tenants in my building are requesting access to their energy usage and HVAC operations data. Can deploying an ACE IoT IDL help me provide the data my tenants are requesting? If so, how would it work?
A: The easy answer is—YES. An ACE IoT IDL can provide a cost effective and secure avenue to collect building operations data, segment the collected data by zone, assign zones to tenants and make available to tenants their HVAC operations data on a near real-time basis. Additionally, once data acquisition is established, ACE IoT can help establish virtual submeters that calculate energy usage or other key metrics.
How would it work?
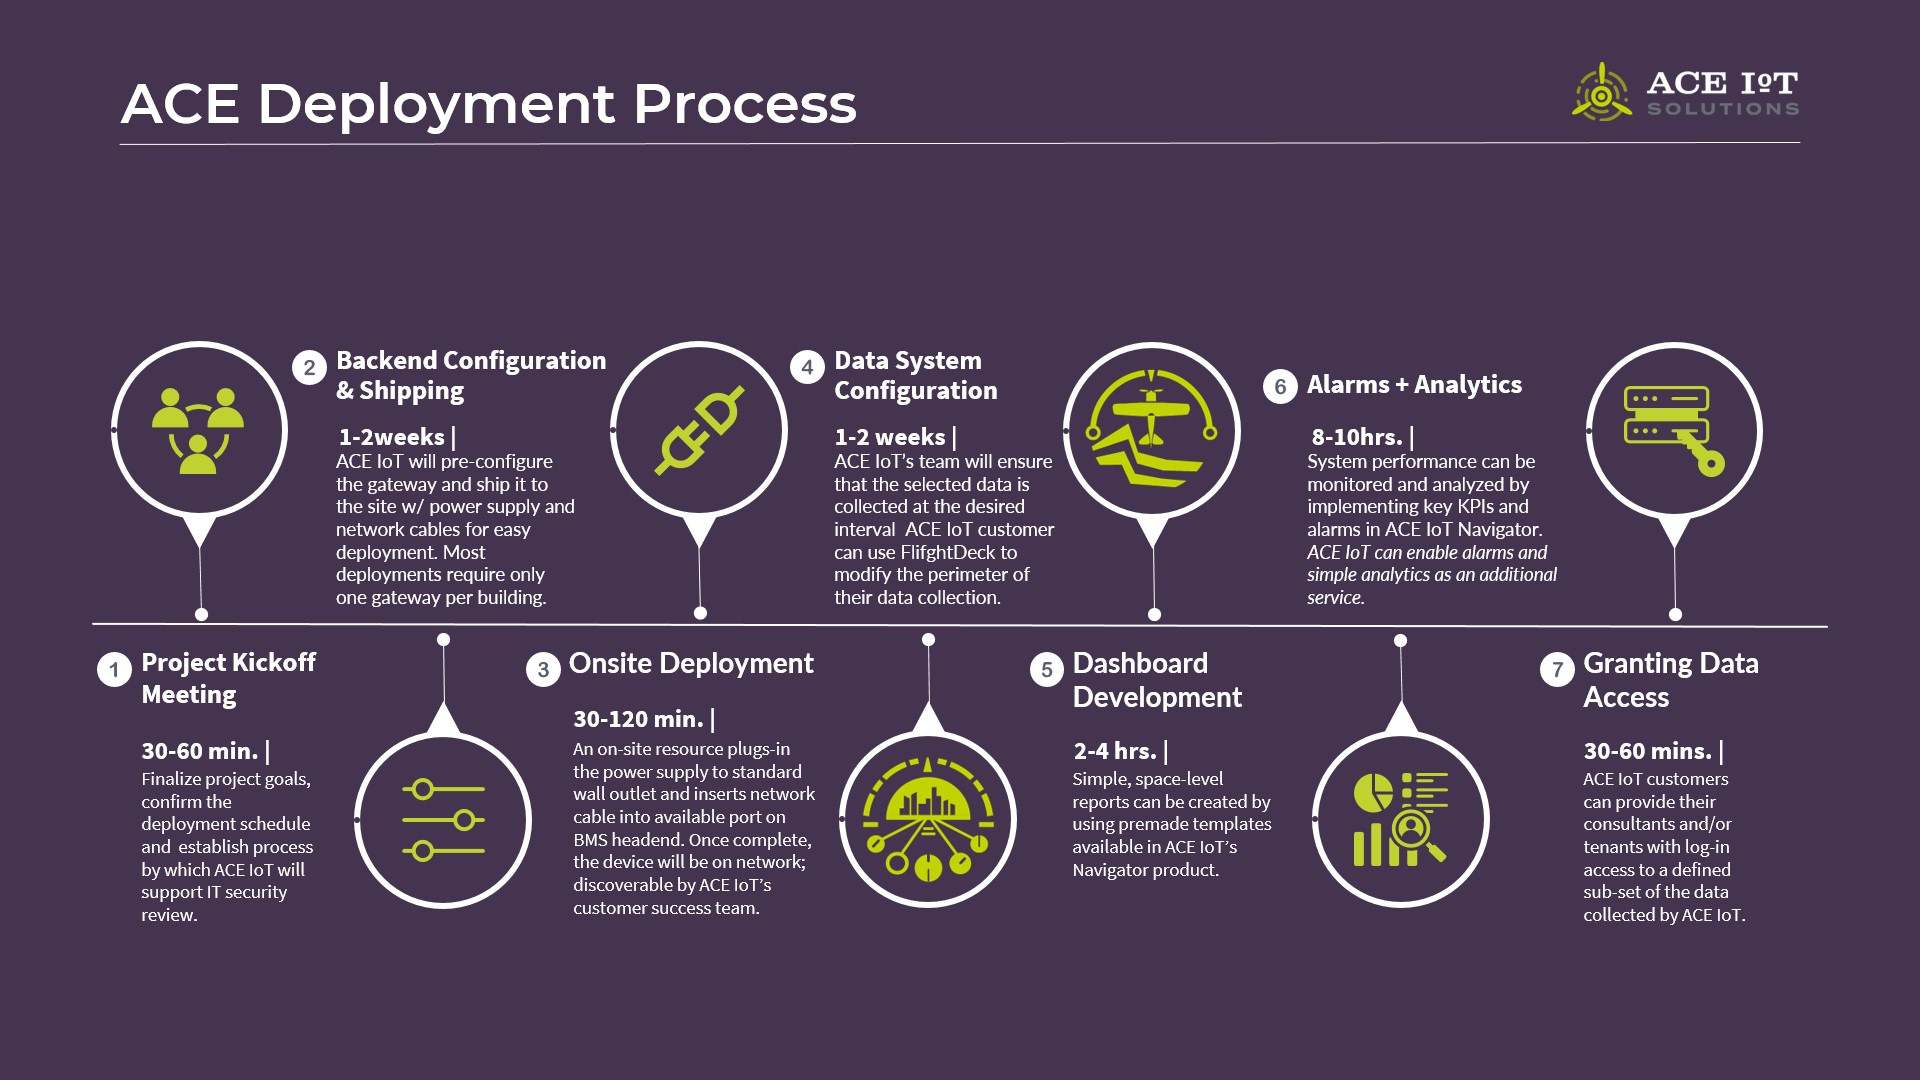
The second part of the question is best answered via a summary of ACE IoT’s standard approach to deploying an Independent Data Layer (IDL). Shout-out to Shelli Langdale for creating the great new visualization of ACE IoT’s IDL deployment process.
Step One. Project Kick-off Meeting. Most IDL deployments start with a meeting during which ACE IoT answers any final questions and outlines next steps related to pending items (e.g., IT approval for the ACE IoT SkyHook gateway).
Step Two. Backend Configuration and Shipping. ACE IoT collects information about network environment where the SkyHook gateway will be deployed and confirmation about the client’s preferred method for the SkyHook gateway to access the Internet. The SkyHook gateway is preconfigured for the deployment site and mailed to the point-of-contact responsible for onsite deployment.
Step Three. Onsite Deployment. The preconfigured SkyHook need only be connected to s building’s BAS or to a controller. In most cases, one SkyHook gateway can handle data collection for a whole building.

Step Four. Establish and Refine Data Collection. From a remote location, ACE IoT’s Customer Success Team can scrape BACNet enabled points from HVAC and Building System equipment that shares the same subnet as the SkyHook gateway. In collaboration with our customer, ACE IoT Customer Success Team identifies the points to trend from the site to the Aerodrome platform and—using the ACE IoT FlightDeck interface—selects the desired points and enables trending.
Step Five. Data Dashboard Development. Once the time-series data is streaming into the Aerodrome platform, the data can be delivered directly into a 3rd party analytics suite (e.g., SkySpark) or accessed thru ACE IoT’s API. Data can also be visualized in ACE IoT’s Navigator powered by Grafana, Data visualizations are easily created and modified in Navigator.
Step Six. Alarms and Simple Analytics. Using FlightDeck to assign tags to data (e.g., to all AHUs or all temperature data), ACE IoT customers identify and then slice and dice the data that is of greatest value to them. In Navigator, ACE IoT customers establish real-time data dashboards that can be easily downloaded into monthly reports. Also in Navigator, customer create alarms that send notifications when threshold values are exceeded and can implement simple analytics that identify the dates and times when a facility’s demand exceeds a rolling average, eg.
Step Seven. Granting Data Access. Each ACE IoT customer receives unlimited log-ins for Navigator, where customers can see only the data from their sites.
OK, what does all this have to do with responding to a tenant’s request for their energy usage data?
ACE IoT customers can make available to their tenant(s) a subset of the data collected from the whole building. To accomplish this, the ACE IoT Customer Success team would use FlightDeck to tag all the data collected from the floor(s) or zone(s) of a building that a tenant occupies. Once the data is tagged, ACE IoT would then stream all the tagged data into separate data dashboards for our customer’s tenant(s) and provide virtual site instances in the FlightDeck API for programmatic access.
Without an IDL, securely segregating data and providing virtual submetering in a BMS is difficult and time consuming. The reason for this is simple–BMS were not envisioned for providing access to granular data for each tenant. In the absence of an IDL, a building owner who wishes to provide tenant-specific data would, most likely, need to pay a BMS provider to manually setup virtual points for common system parameters for each tenant. Because this process is time consuming in a click-to-configure BAS systems, in most cases providing tenant data is prohibitively expensive.
Leveraging an IDL, ACE IoT can support efforts by an engineering firm to use building operations data to create a virtual submeter.
Armed with building operations data, energy engineers can model energy usage for the different operating modes of a piece of equipment and calculate energy usage via a “virtual submeter” without metering individual pieces of equipment. In some cases, energy engineers can use an IDL to measure directly the energy delivered by equipment in a different domain than electrical. For example, if an engineer has access to data including the discharge temperature and volumetric flow of a VAV, they can—based on their knowledge of the rest of the system—calculate a reliable measurement of the energy being delivered into the space, and the electrical energy used by the system delivering that energy.
An Aerodrome IDL facilitates virtual submetering of this vein via easily configurable dashboards. There may be no need to reprogram the BAS or deploy edge controllers to calculate energy usage KPIs. As more and more companies are required to report on their carbon emissions, is easy access to energy usage data a new amenity contributing to tenant satisfaction?

